Client
 European Union
Summary
This work was done at Technical University in Eindhoven as a part of the Concept (Collaborative Creative Design Platform) project supported by the European Union.
When
2015
My role
This project has been done from scratch by me and Jesus Muñoz, PhD in Technical University of Eindhoven. I was responsible for design, prototyping, and development. Jesus helped me with the research and initial analysis. During this project, we collaborated a lot and further in the text I will refer to us as a team.
Intro
Over the past years we have seen that the techniques of designing have improved a lot. Many different people and industries, who have been involved in design, have settled upon a common set of methods for doing human-centred design. Everyone has his or her own favourite method, but all are variants on a common theme expressed through the four stages of: observation, generation, prototyping, and testing (Norman, 1998).
We assume that the basis for the design process will stay similar to what we have now but the way how designers work and collaborate will be changing. Information technologies evolve rapidly and affect the possibilities for development and design. Currently, even if a team of designers is not distributed around the World, it might be much more efficient to interact via the web. This is also the case because nowadays designers operate with a large amount of digital information including a range of types, and exchanging and sharing this information might only be possible only using digital services.
Client
European Union
Summary
This work was done at Technical University in Eindhoven as a part of the Concept (Collaborative Creative Design Platform) project supported by the European Union.
When
2015
The problem
The problems were revealed during the research where we interviewed designers about their daily routine. I won't go into the details here but highlight main problem statements we identified:
Tracking support. Designers find it difficult to track back through what happened during a certain period of time. It is complicated to filter and recall the most relevant information. Designers use multiple sources of information (drawings, pictures, texts, numbers) and tools that are hard to track and structure in a specific moment.
Feedback support. Designers find it complicated to get feedback from the team or stakeholders on an artefact especially with specific level of details.
Collaboration support. Designers find it hard to share their own progress or follow the progress of what other team members are doing when working on the same or related tasks.

Design process
Initially, we identified a typical information flow for a designer. As an illustration of this we took a process of creating a concept of a lamp.
- Receiving an email from stakeholders with a vision of the future product
- Creating the list of requirements according to the stakeholders vision
- Exploration of the existing solutions and selecting the most interesting
- Creating a mood board
- Market research and creating a document with the results
- Brainstorming and posting the ideas to the board
- Sketching
- Prototyping
Rethinking files organization
Let's imagine you have a shared folder on Dropbox or Google Drive with some files your colleagues and you share with each other. It can be even well structured with subfolders, file names specifications, etc. But what is it missing? It's very static, it's missing all the events happening around these files.
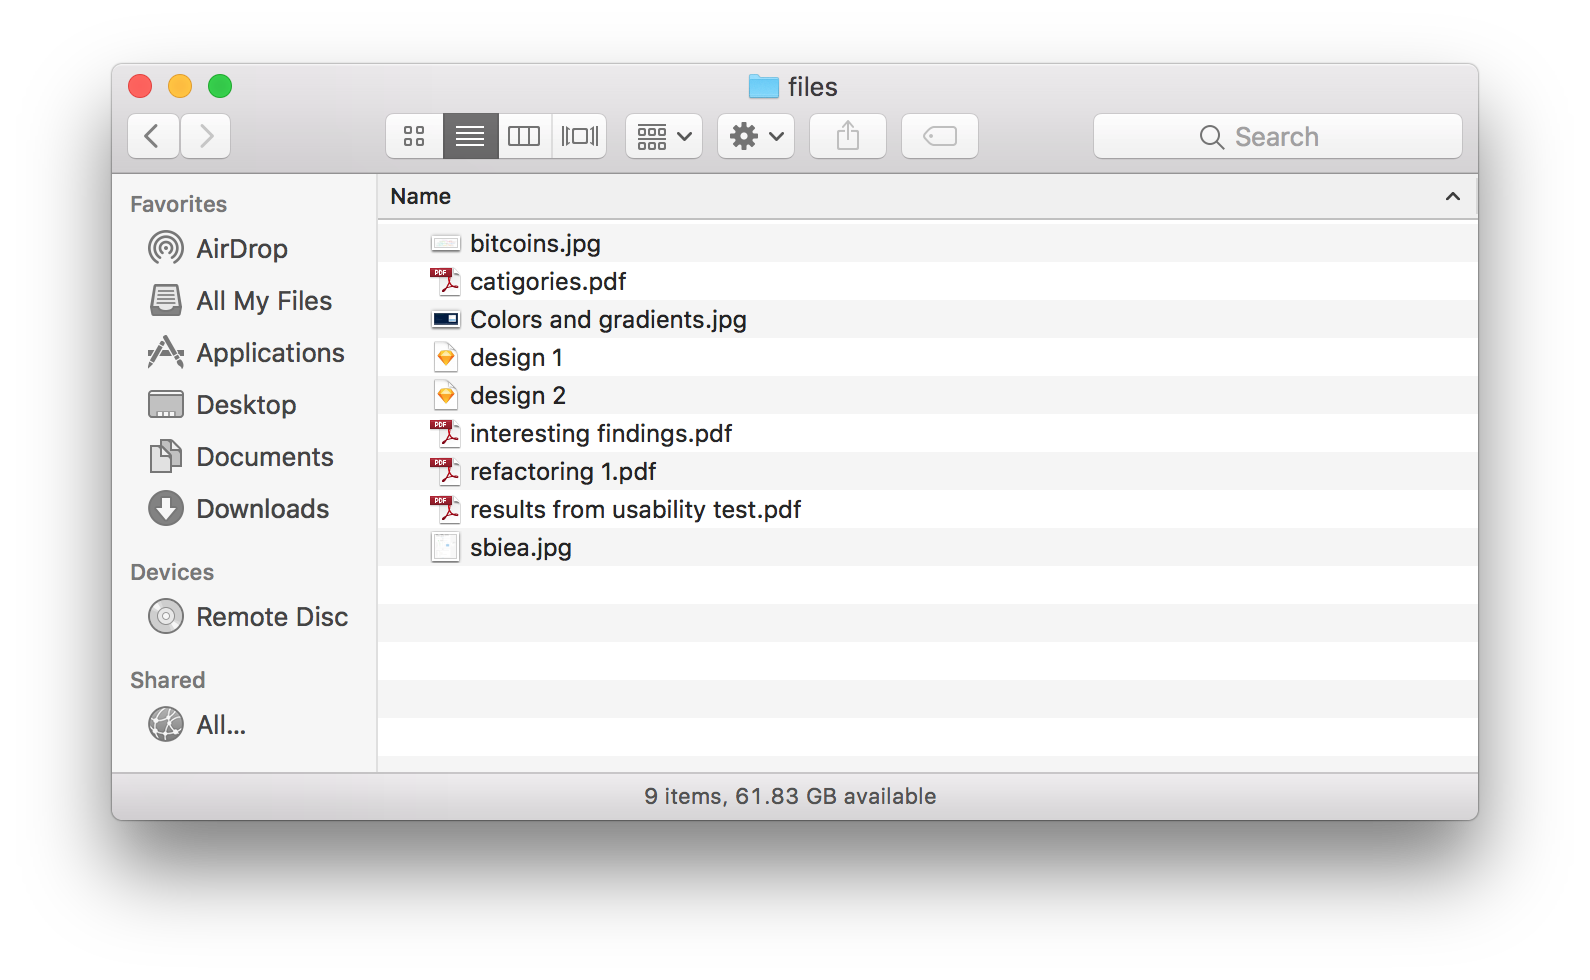
We interviewed designers and based on the feedback we identified key features for the product:
- Allow connecting the tool with existing file-sharing services
- Showing changes in time perspective (a day or a week’s perspective)
- Adding category to each file
- Allow leaving feedback and commenting on each file
- Easy sharing outside
- All this in one interface

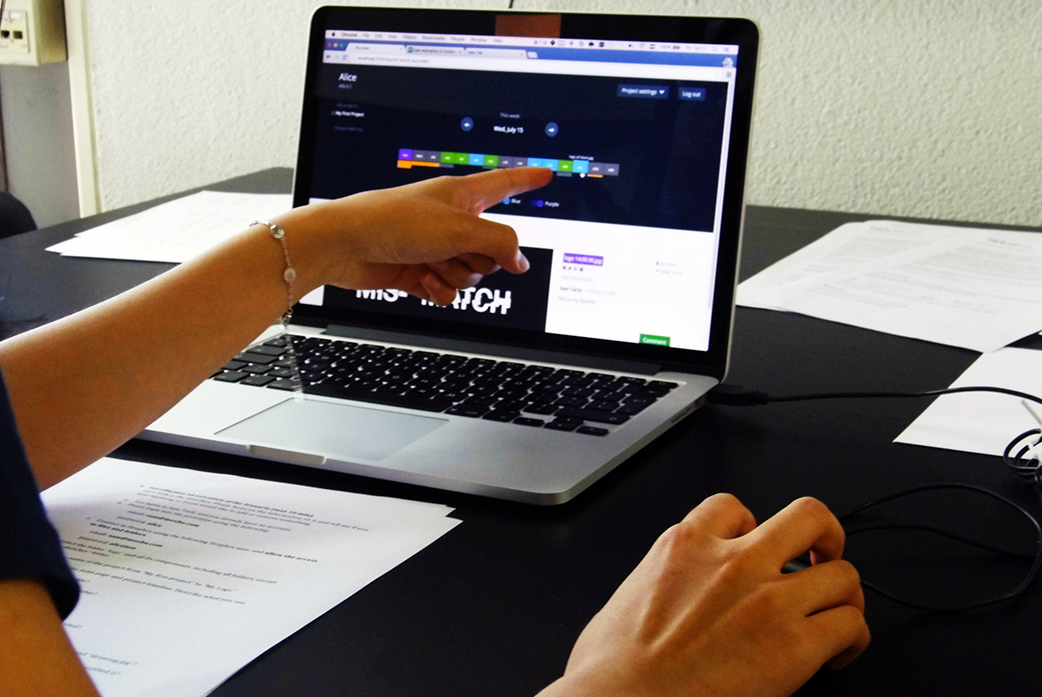
Each of these items represents a file and inside of each block a shortcut of a name is placed. This shortcut is a collection of three letters randomly selected from the file name. The height of the each blocks correlates with the amount of revisions over a selected period of time. Some of the items have a bottom part. The bottom blocks show how big a discussion around a file is and the height of this block correlates with the amount of comments. Designers are able to categorize files and map them to specific state of the design process.

Prototype
Timeline and main dashboard of the tool.

Settings screen with connected Dropbox account.
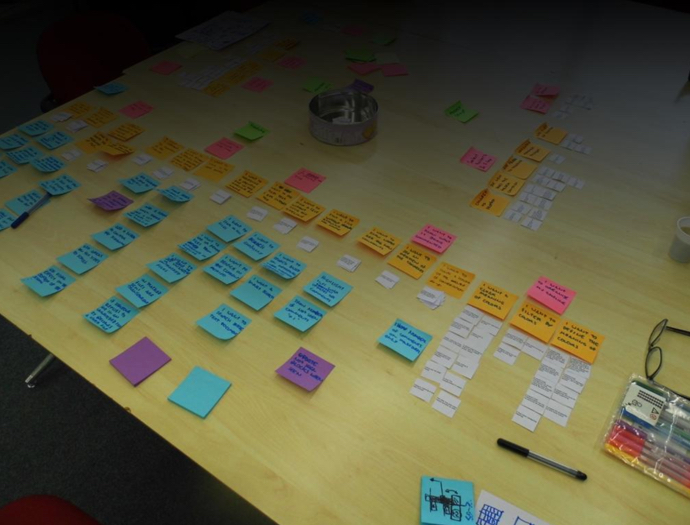
User testing
The prototype we built supported Dropbox. After a designer connected it he or she immediately saw files that were recently added or changed. During the test, it impressed designers because they saw familiar information in a new way. However, there were a lot of points to improve.
After the user testing we transcripted all feedback in Google Sheets. Afterward, it was printed and we grouped all the findings into goals and features. The features became a basis for further improvements and new functionality.